Help Center
Guide to the Optima Villas admin dashboard
Welcome to Optima Villas Dashboard System
ℹ️
The Optima Dashboard is a centralized platform that brings together reservations, payments, staff, suppliers, and financial data in one secure location. Instead of juggling spreadsheets and multiple apps (Zoho, Zendesk, Zapier), everything flows into unified dashboards.
How Data Flows Through the System
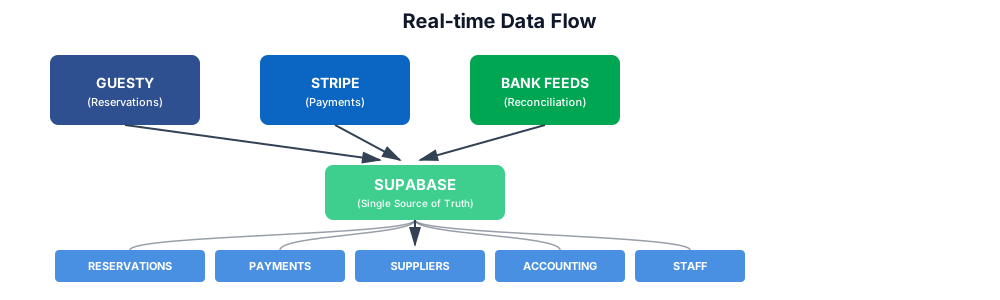
Real-time data sync from Guesty, Stripe, and Bank feeds into Supabase, then to each dashboard
Key Principles
- ✅ Single Source of Truth: All data in one secure location
- ✅ Real-time Visibility: Updated automatically every 10 minutes
- ✅ Role-based Access: You see only what you need
- ✅ Scalability: Designed to grow without complexity
- ✅ Auditability: Full tracking of all changes
Reservations & Payments Dashboard
The Reservations & Payments Dashboard is the financial heart of Optima Villas. It combines all booking data from Guesty with payment data from Stripe, allowing you to see revenue, commissions, and cash flow in real-time.
What You'll See at a Glance
📊
Total Reservations (This Month)
34
+8 from last month
💰
Total Revenue
€45,200
GBP £38,500
✅
Payments Received
€42,100
93% of revenue
📈
Commission This Month
€5,200
Avg 11.5% per booking
Example: How to Read a Booking
📋 Priscilla books Villa Princesa Irene
Scenario
Priscilla Beirne books Villa Princesa Irene from June 18–25, 2027 via Airbnb.
| Booking Code | Guest | Property | Check-in | Check-out | Amount | Channel | Commission | Status |
|---|---|---|---|---|---|---|---|---|
| HMZW2MQFPH | Priscilla Beirne | Villa Princesa Irene | 18 Jun | 25 Jun | €2,380 | Airbnb | €357 | Paid |
Result
Guest: Priscilla Beirne (UK) · 7 nights · Total Revenue: €2,380 (Guesty) · Commission: €357 (15%) · Status: Payment received from Airbnb.
Payment Status Explained
| Status | Meaning | Example |
|---|---|---|
| Pending | Booking confirmed, payment not yet received | Guest paid Booking.com, money still in transit |
| Paid | Full payment received | Cash in Optima's bank account |
| Partial | Some payment received, balance due | €1,000 received of €2,000 total |
| Refunded | Payment returned to guest | Guest cancelled, money returned |
⚠️
A booking can be confirmed in Guesty but payment may still be pending. Always check the Payment Status column before assuming money has arrived.
Suppliers Dashboard
The Suppliers Dashboard tracks all services provided by vendors (cleaning, maintenance, pool service, etc.) and calculates costs, margins, and profitability for each service. It shows what Optima pays vendors and what we charge owners.
The Supplier Workflow
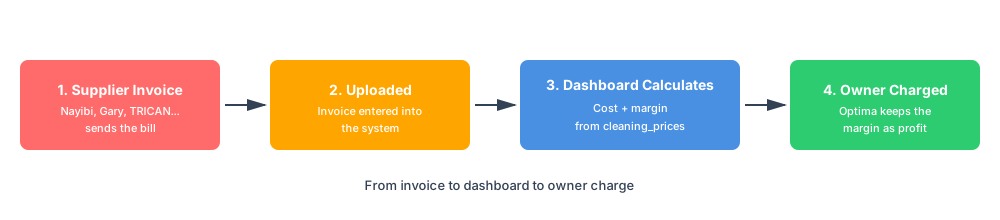
From invoice to dashboard to owner charge
Real Example: Deep Clean of Casa Azul
📋 Deep Clean of Casa Azul
Scenario
Guest checks out of Casa Azul. Cleaning is needed before the next guest arrives. Nayibi (cleaning service) is assigned, submits an invoice for €50 dated September 5, 2026.
Result
Owner statement shows "Deep Clean (Sep 5): €59". Optima Accounting: Cost to Nayibi €50, Revenue from Owner €59, Margin €9.
Margin Calculation Formula
ℹ️
Optima's Margin = Charge to Owner − Cost to Supplier. Example: Supplier Cost €50, Optima Margin 18% (standard for cleaning), Charge to Owner €59, Optima's Profit €9.
💡
Higher margins don't mean unfair pricing. They reflect Optima's overhead (platform maintenance, customer support, quality assurance, payment processing, risk) plus profit.
Current Suppliers & Standard Margins
| Supplier | Service | Standard Margin | Example Cost | Example Charge |
|---|---|---|---|---|
| Nayibi / Serviclean | Cleaning | 16–18% | €50 | €59 |
| Gary | Maintenance | 15% | €100 | €115 |
| TRICAN | Pool Service | 20% | €30 | €36 |
| John | Custom Services | 15–20% | Varies | Varies |
Staff Management Dashboard
The Staff Dashboard tracks team attendance, hours worked, vacation requests, and compliance. It provides a visual calendar where you can see who's working when, and KPIs like total hours, vacation days taken, and compliance percentage.
Calendar Overview
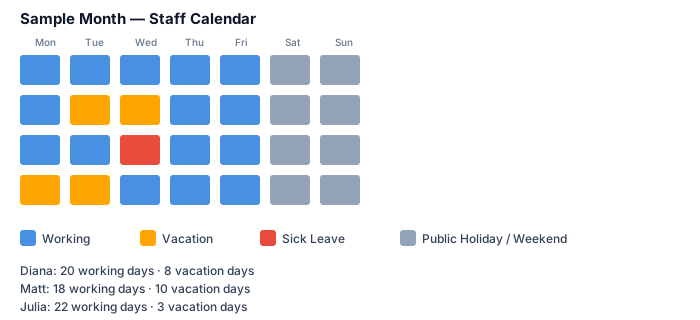
Sample month showing staff status, vacation, and holidays
How to Submit a Vacation Request
📋 Requesting time off
Scenario
Step 1: Click on your calendar day. Step 2: Select "Submit Request". Step 3: Choose type: Vacation, Sick Leave, Training. Step 4: Click "Submit".
Result
Sonia gets notified and approves or rejects the request.
💡
Submit requests as early as possible. Sonia reviews daily, but early notice helps with coverage planning.
Your KPIs
🗓️
Scheduled Hours
160
This month
⏱️
Hours Worked
158
98.8% compliance
🏖️
Vacation Days
8
Remaining: 12
✅
Compliance
98.8%
Target: 95%
Payments & Accounting Dashboard
The Accounting Dashboard centralizes all financial data: invoices, payments, expenses, revenue, and reconciliation. It's designed for the accounting team to track money in and out, match transactions, and generate financial reports.
Monthly Financial Overview
💰
Total Revenue
€45,200
💸
Total Expenses
€18,500
📈
Operating Profit
€26,700
✅
Profit Margin
59.1%
Real Example: Monthly Reconciliation
📋 September 2026 reconciliation
Scenario
Revenue: Guest Payments (Stripe) €45,200, Other (Refunds/Adjustments) −€500 → Total Revenue €44,700. Expenses: Cleaning (Nayibi) €8,500, Maintenance (Gary) €6,200, Pool Service (TRICAN) €3,400, Fixed Costs €4,100 → Total Expenses €22,200.
Result
Operating Profit: €22,500 · Profit Margin: 50.3%.
Invoice Reconciliation Process
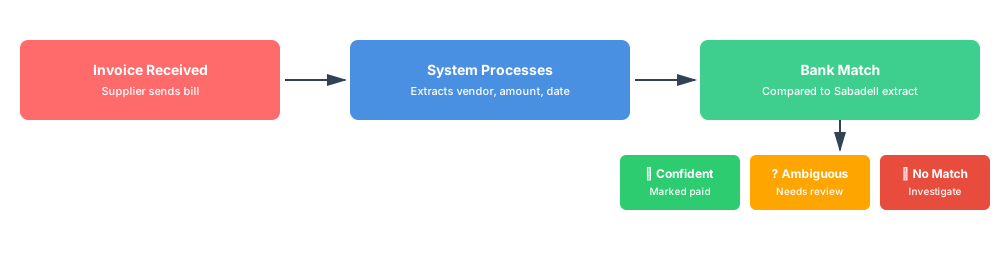
From invoice upload to matched transaction
⚠️
If an invoice is marked as "No Match," it means the bank transaction wasn't found. Check: (1) Is the amount exact? (2) Has it been paid yet? (3) Is the date recent?
Owners Dashboard — Your Property Performance
The Owners Dashboard (accessible via Owner Portal) shows property owners a complete view of their rental performance, revenue, costs, and payouts. Each owner sees only their own properties and financial details.
What an Owner Sees: Real Example
📋 Villa Dolores — September 2026
Scenario
Owner: Maria García · Property: Villa Dolores · 3 bookings, Gross Revenue €7,140 (3 × €2,380 avg per booking).
Result
Owner's Net Payout: €7,140 − €1,805 = €5,335.
💡
Owners can see exactly where their money goes. Transparency builds trust.
Monthly Statement Structure
| Line Item | Amount | Notes |
|---|---|---|
| Gross Revenue | €7,140 | From all bookings |
| Optima Commission | −€1,071 | 15% management fee |
| Booking.com Commission | −€214 | 3% channel fee |
| Insurance | −€143 | Monthly property insurance |
| Cleaning Costs | −€177 | €59 per checkout clean |
| Maintenance Costs | −€200 | Gary's repairs |
| Net Payout to Owner | €5,335 | Deposited to bank account |
Web Dashboard — Manage Your Website
The Web Dashboard allows content management of the Optima Villas website. Update property descriptions, images, and metadata without needing technical knowledge.
What You Can Edit
- Property names, descriptions (EN/ES)
- Property photos and gallery order
- Amenities lists
- Pricing and availability
- House rules
- Check-in instructions
- Landing page content (hero, testimonials)
- SEO metadata
💡
Changes take effect immediately. No need to redeploy or wait for updates.
Getting Help — Support Options
You have multiple ways to get help with the dashboard system.
Option 1: Built-in Chatbot (24/7)
ℹ️
Click the Chat icon (💬) in the bottom-right corner of any dashboard page. It can help with: general dashboard how-to questions, navigation and features, standard operational questions, and password resets. Example: "How do I view my bookings?" → instant answer.
Option 2: Direct Email (24–48h response)
ℹ️
For anything urgent, critical, or that needs human review, email sales@optimavillas.com. Contact for: technical issues or bugs, data corrections or disputes, feature requests, sensitive financial discussions, access/permission issues, or anything marked [URGENT].
💡
Mark urgent issues with [URGENT] in the subject line for faster response.
Frequently Asked Questions
📋
Why did we move away from spreadsheets? — Spreadsheets work until they don't. As Optima grows, managing data across multiple sheets creates errors, duplication, and miscommunication. A centralized dashboard ensures one source of truth, real-time updates, and automatic calculations.
📋
Do I have to stop using my spreadsheets? — No. During transition, we'll continue using spreadsheets for data entry, then sync that data into dashboards. Over time, more processes move directly into the system.
📋
What if I find a mistake in the dashboard? — Email sales@optimavillas.com immediately with details. It will be investigated, corrected, and followed up on.
📋
Is my data secure? — Yes. All data is stored in Supabase with bank-level encryption. Access is role-based: you see only what you need. Passwords are encrypted, and all connections are encrypted.
📋
How often does data update? — Guesty syncs every 10 minutes. Stripe syncs every hour. Bank feeds update daily. Manual uploads appear immediately.